Help Document
Texas Airport Directory Map
March 2016
Overview
Map Navigation | Switch Basemap | Feature Identification |
The Data Grid | Interactive Legend
Application Tools
(Search Data Tool) (Query Tool)
(Draw Route Tool) (Measure Tool)
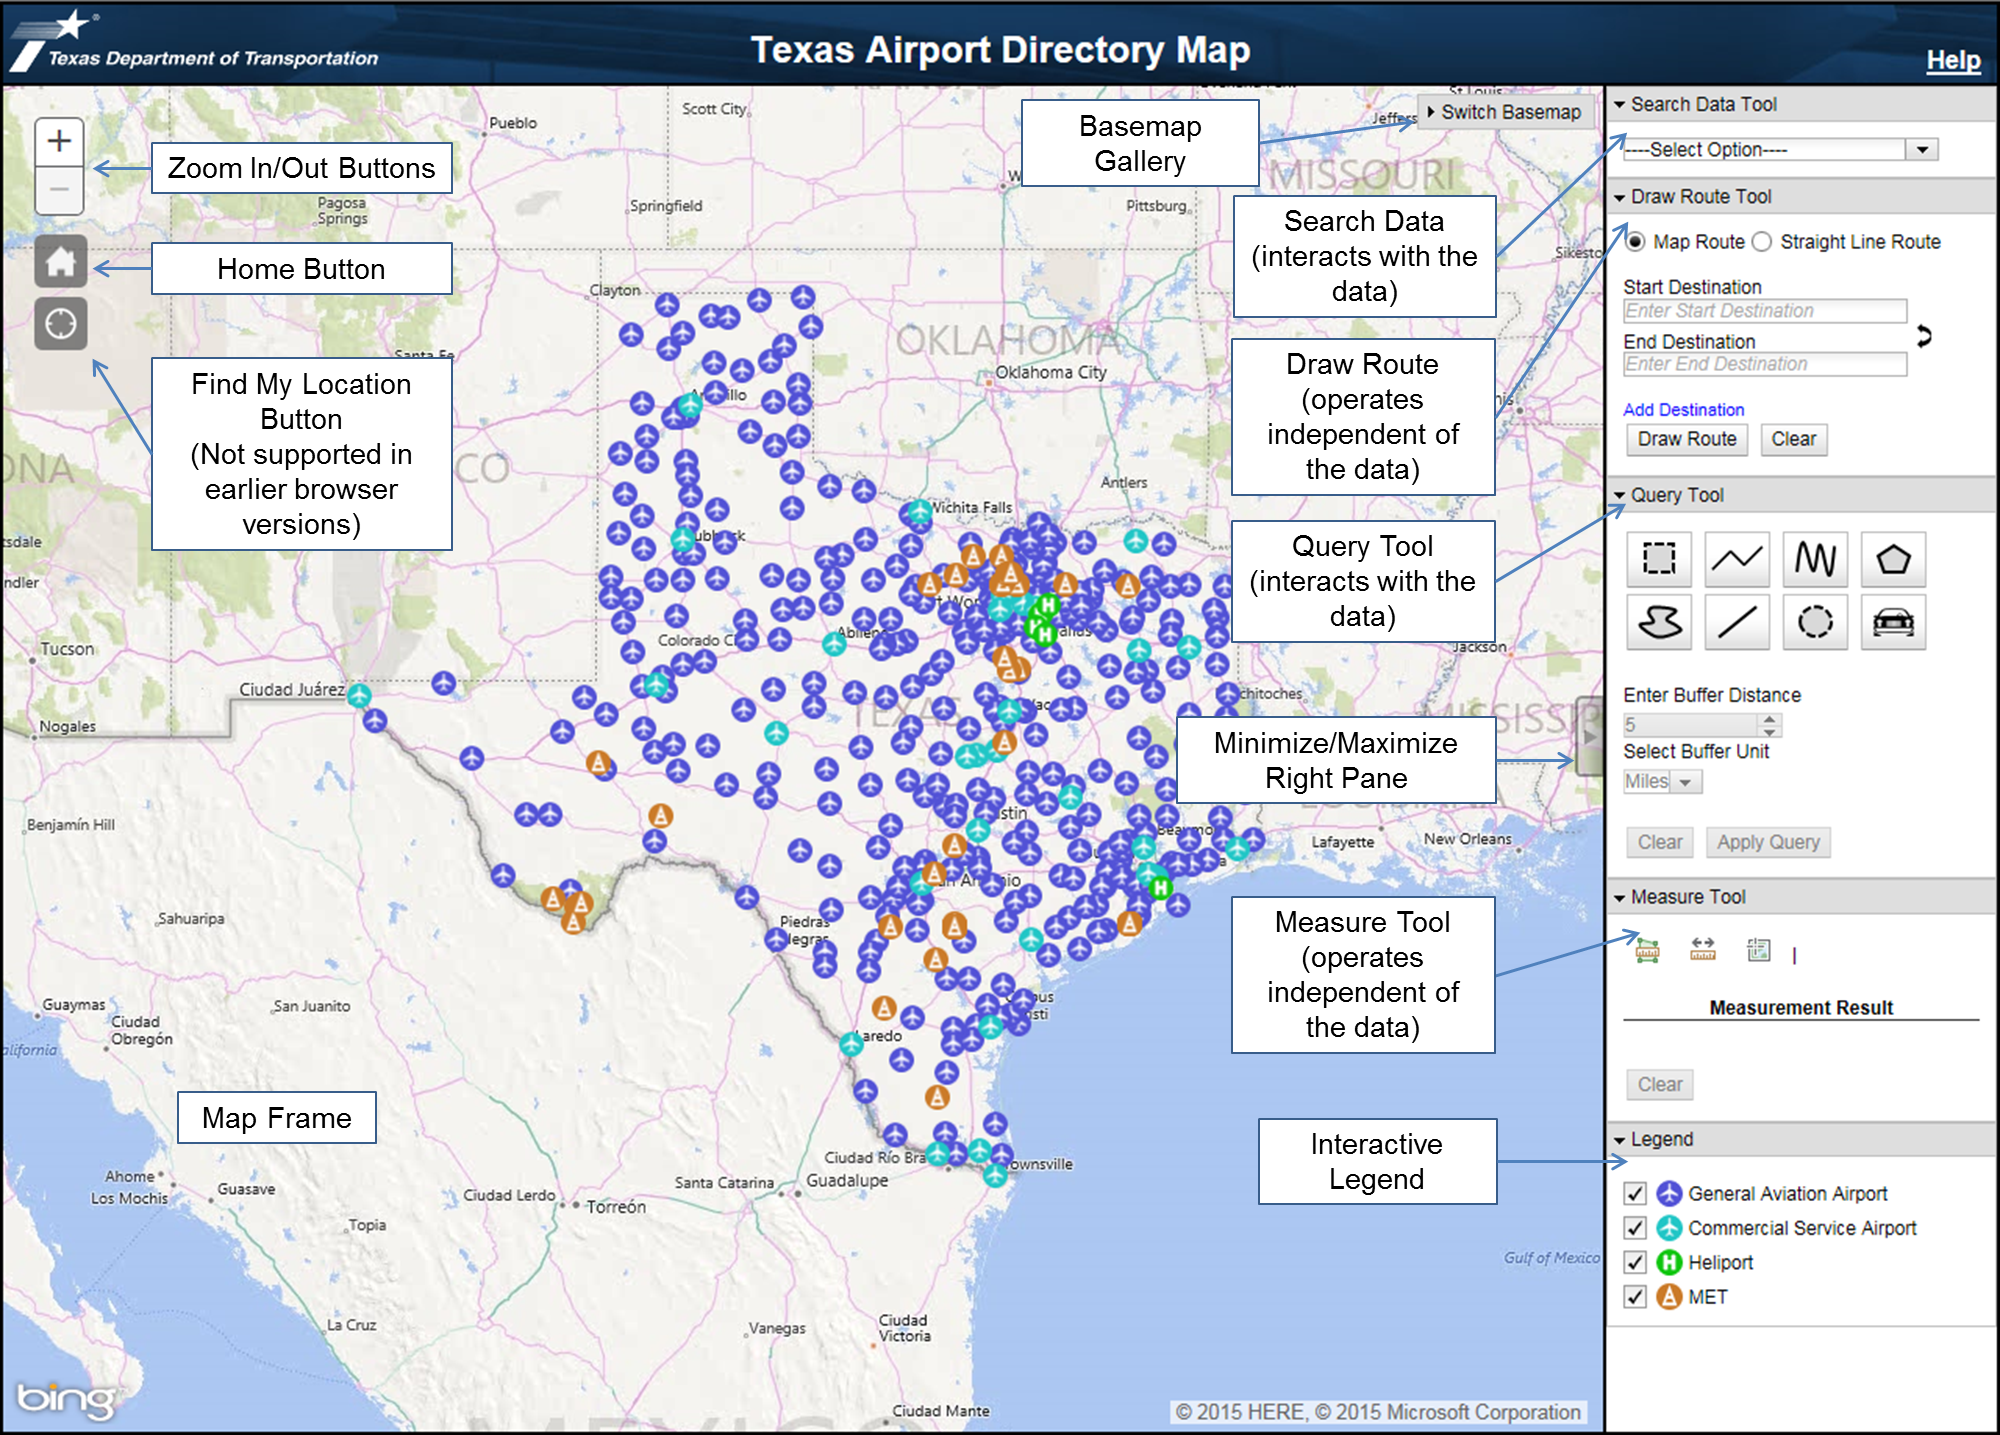
This help document is referring to the Texas Airport Directory Map. The map is a graphical representation of points intended to supply aid for users trying to locate various Airports and/or Meteorological Evaluation Towers (MET) around the State of Texas. Please note that this application comes with some limitations. The data for the application is taken to be for general mapping purposes and is not intended as a sole source of information for flight planning. TxDOT encourages pilots to always refer to the current FAA Airman’s Information Manual, the Airport/Facility Directory, NACO Sectional Aeronautical Charts and NOTAMS. Pilots should contact the nearest Flight Service Station or airport operator to determine current airport conditions and available services prior to each flight. The basemap data is hosted by Microsoft and/or ESRI, independent of TxDOT, so TxDOT has no control as to the content or accuracy of the data.
(top)
Panning navigation within the map can be controlled with the mouse pointer. The user can left click the mouse,
hold the button down and drag the map around the screen to pan the map. The map can be zoomed in and out with
the mouse wheel, by double clicking the left mouse button within the map frame or by using the zoom in/out buttons.
(top)
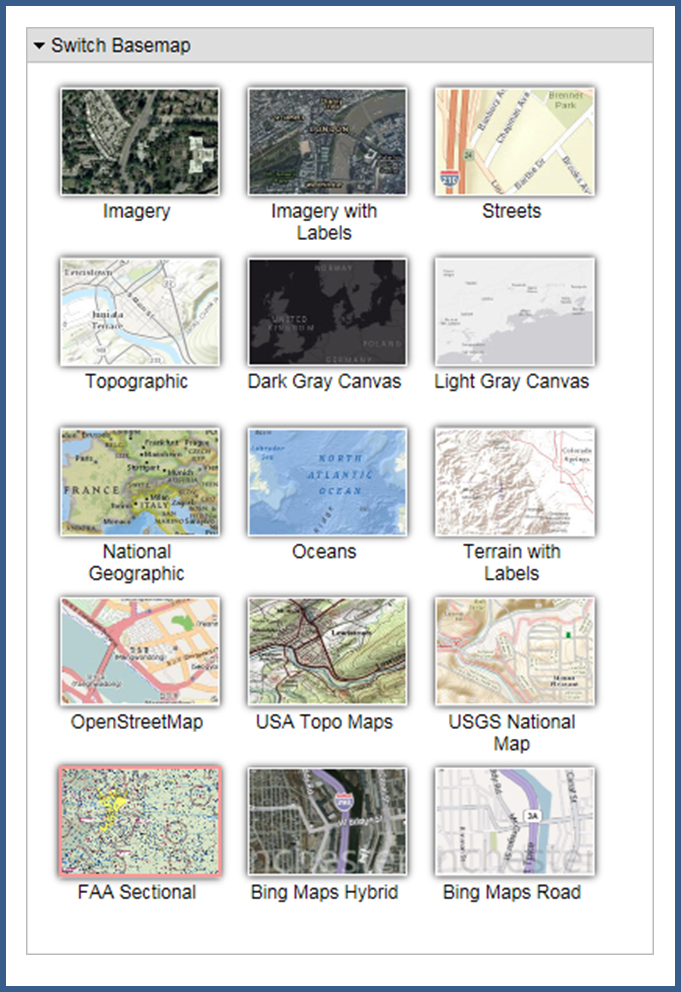
The Texas Airport Directory Map gives the user the ability to switch basemaps. The basemaps are furnished by Microsoft and ESRI, independent of TxDOT, so TxDOT has no control as to the content or accuracy of the data. Use the Switch Basemap window found at the top right corner of the map to switch between basemaps. Click on the Switch Basemap text to expand the window, click on the desired basemap, then click the Switch Basemap text again to minimize the window.
(top)
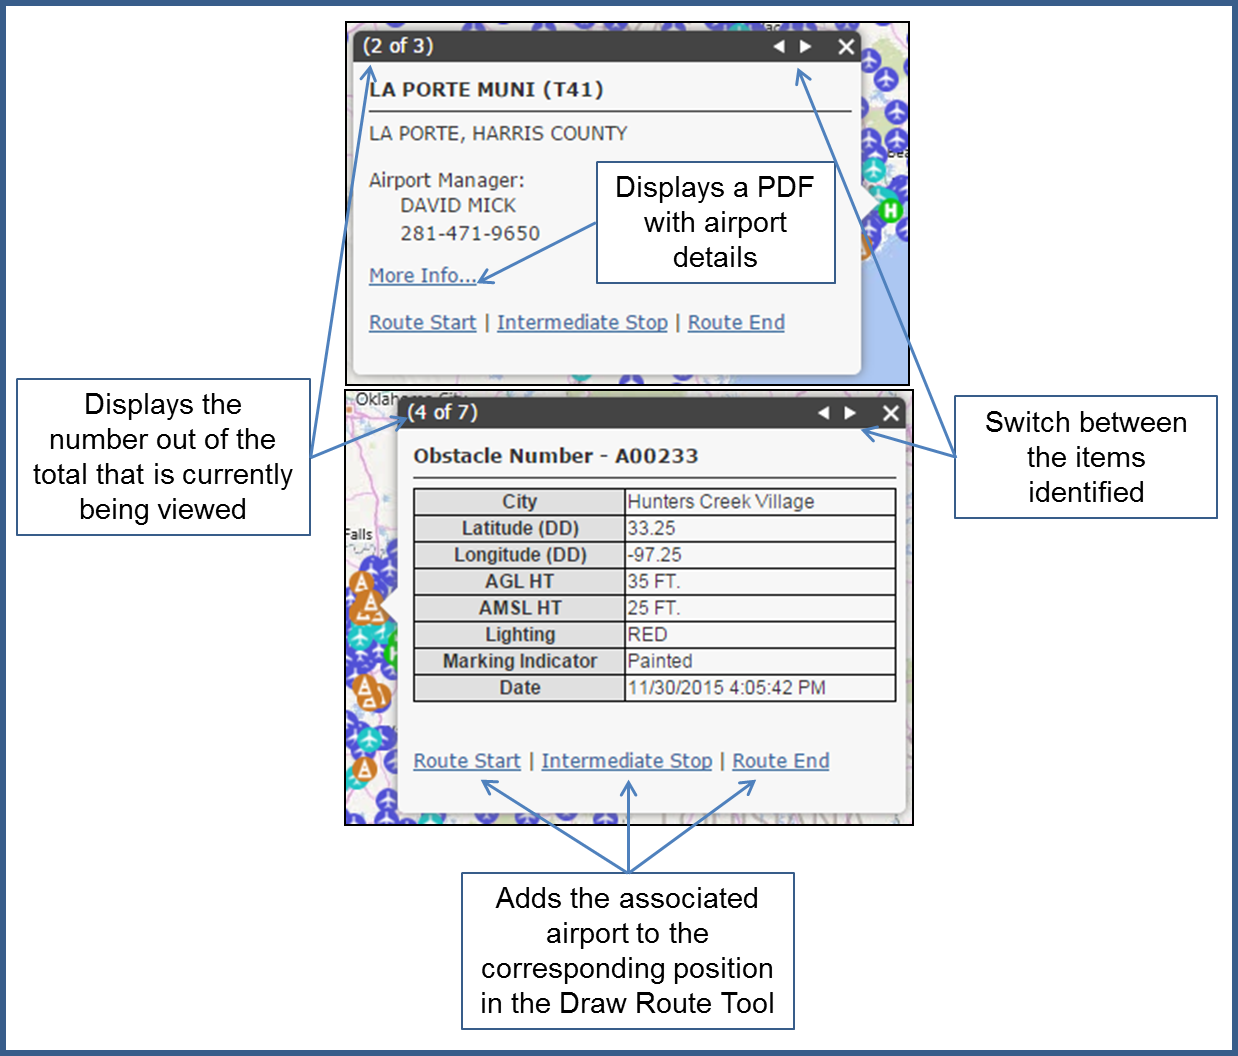
The user can click on an Airport or MET graphic to display the details in a popup. The popup will contain all items that are found under the mouse pointer once clicked.
(top)
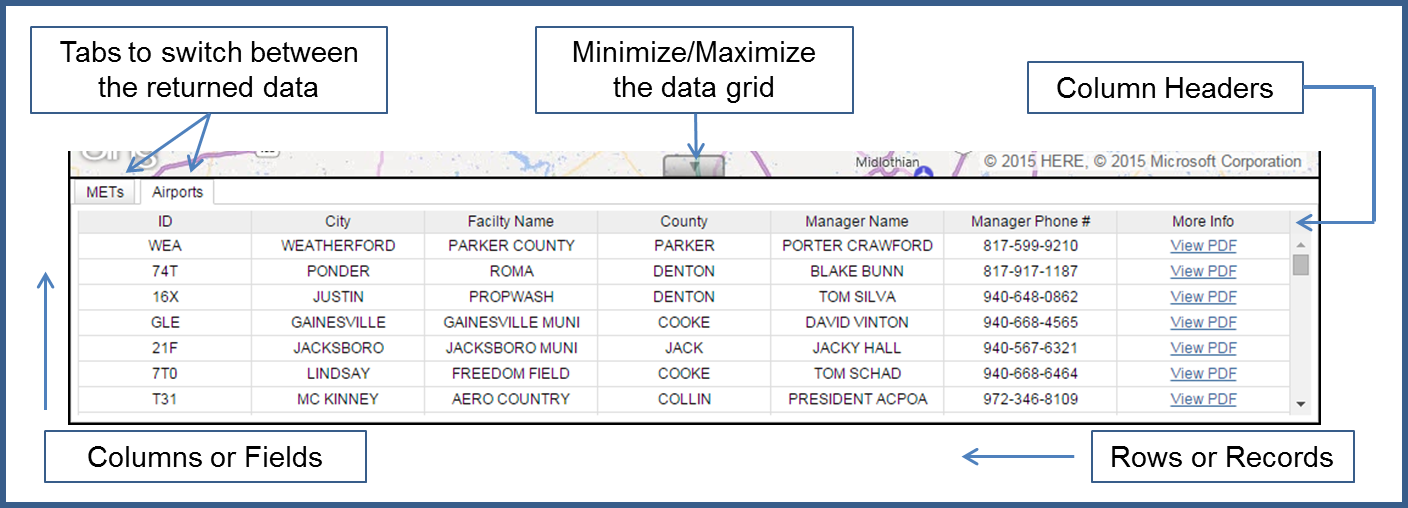
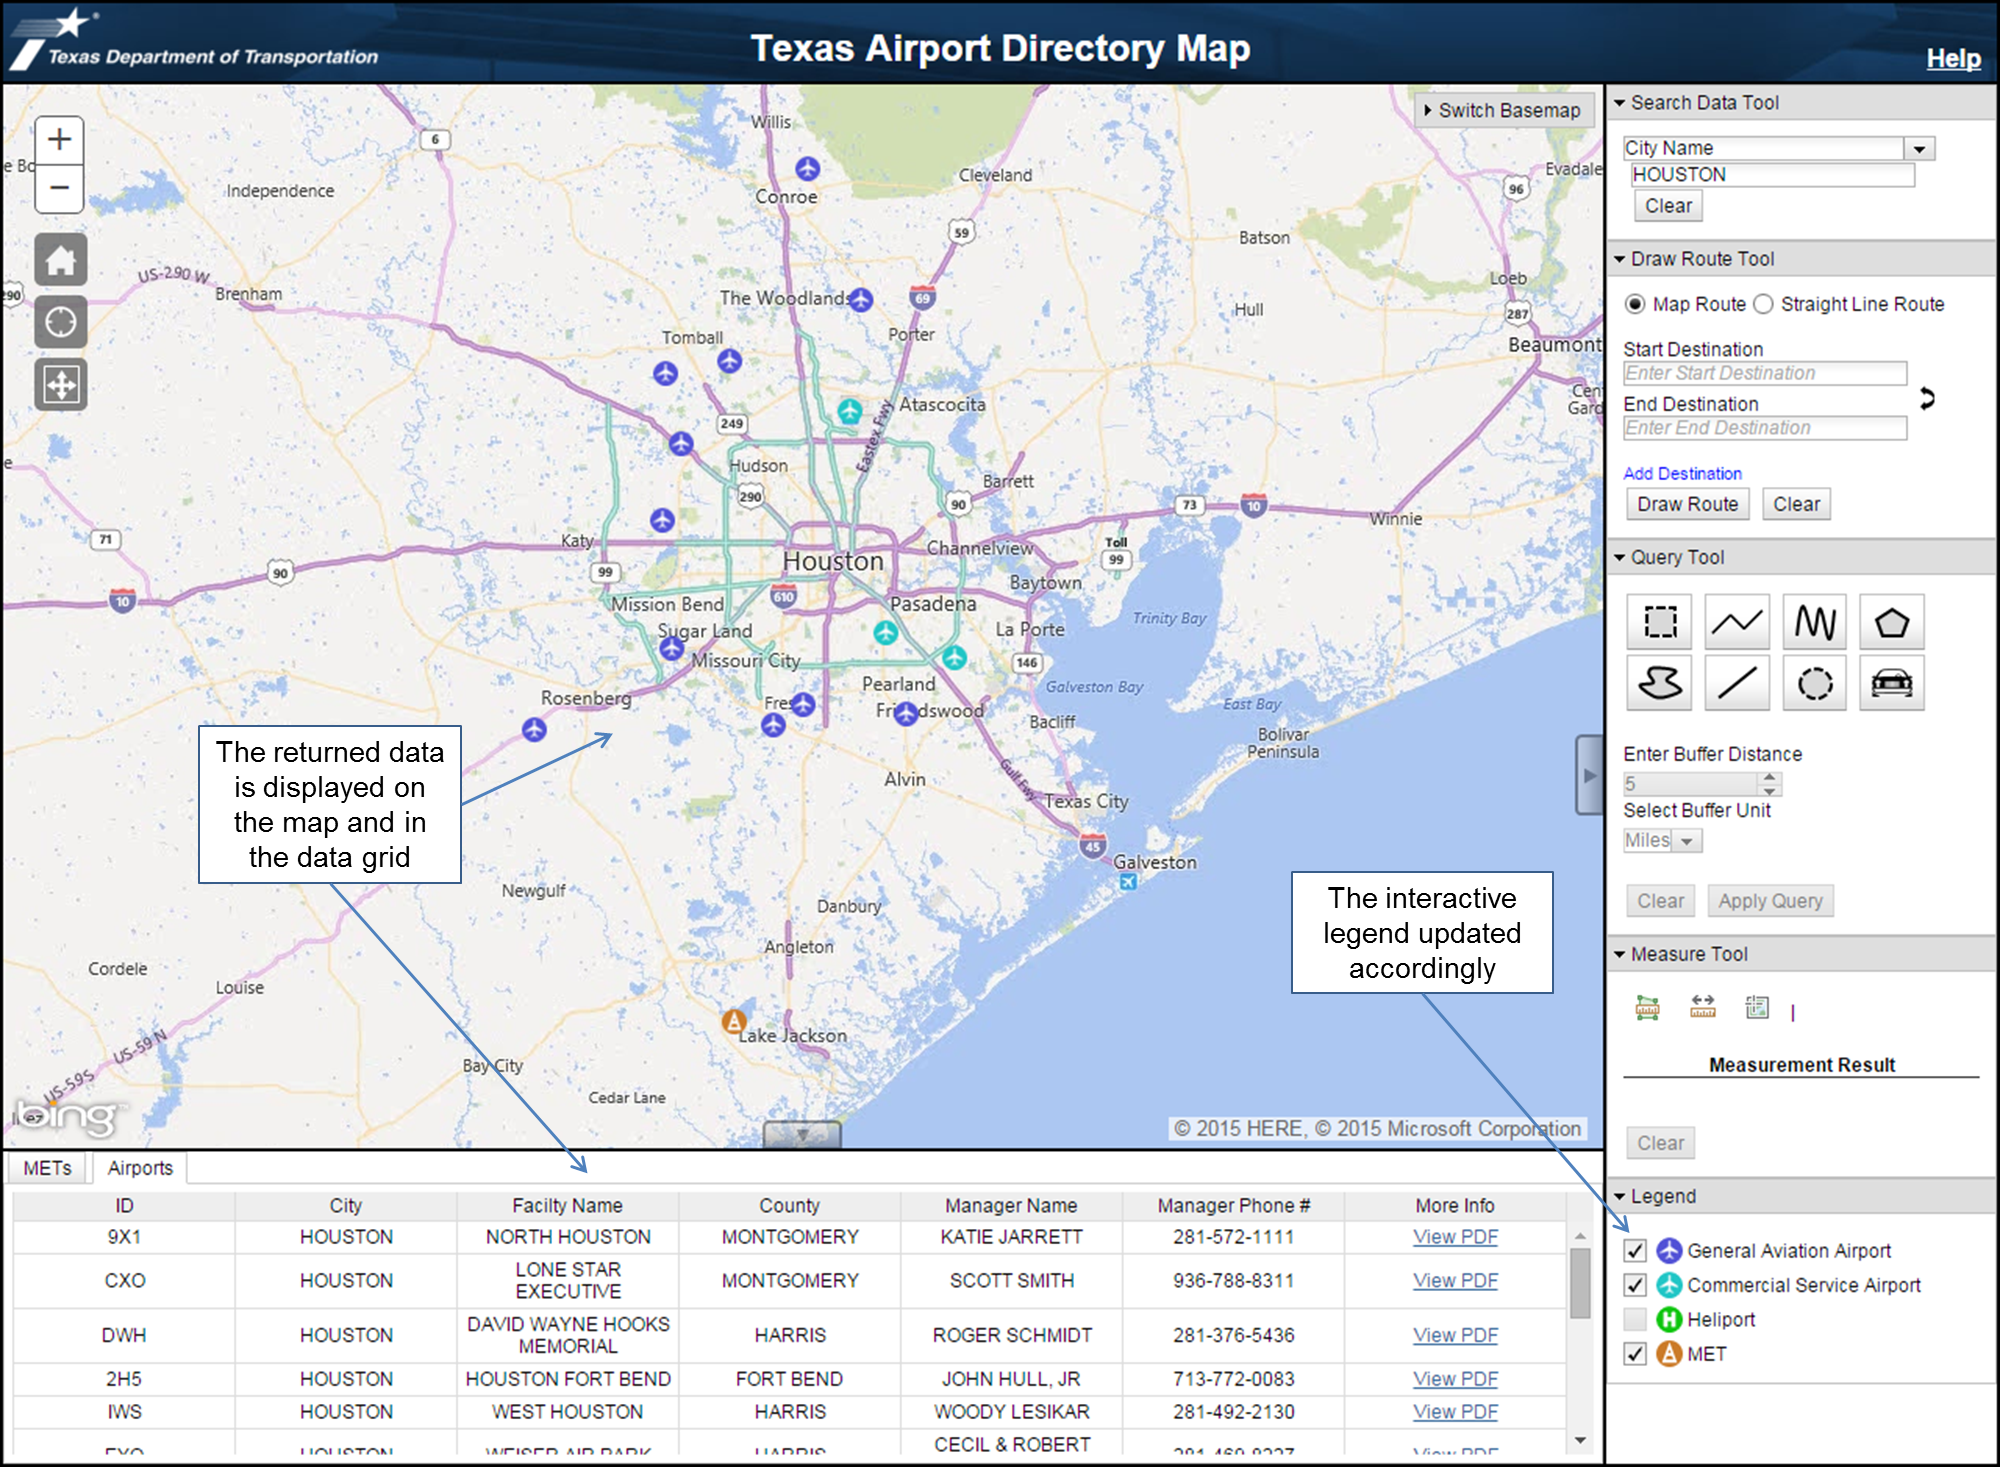
The results of the Search Data and Query Tool will be displayed in a data grid at the bottom of the page in tabs. Click the tab header to switch between the returned data sets. The data grid can be sorted by clicking the header of one of the columns and the columns can be reordered by clicking and dragging the header of the column to the desired location. Clicking on a row in the data grid will highlight that row and zoom the map to the corresponding graphic. Clicking on the highlighted row will unselect the row and zoom the map back out.
(top)
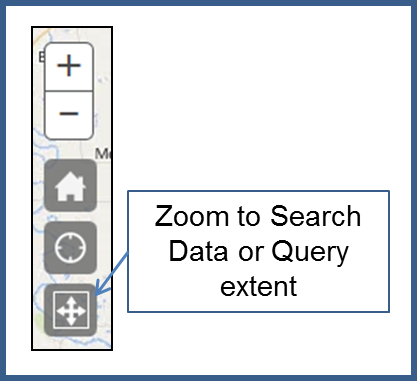
When the data grid is displayed a new button will appear in the area with the zoom in/out, home and find my location buttons. This new button will allow users to zoom back to the extent of the Search Data or the Query graphic.
(top)
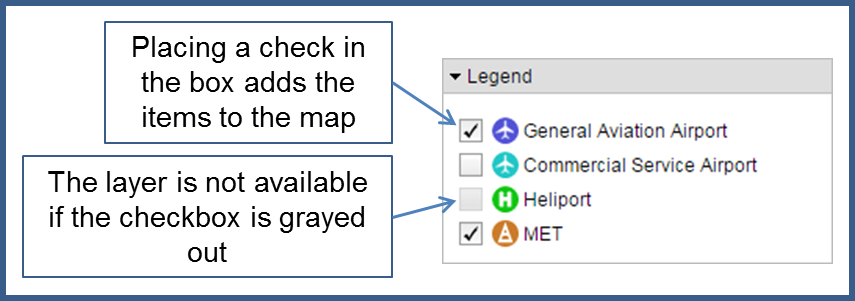
The interactive legend allows users to add/remove the different data layers to/from the map. If the checkbox is grayed out the corresponding layer is not available; usually as a result of the Search Data Tool.
(top)
The Texas Airport Directory Map has four tools that can be used within the application; Search Data Tool, Query Tool,
Draw Route Tool and Measure Tool. The Search Data and Query Tools interact with the data while the Draw Route
and Measure Tools do not.
(top)
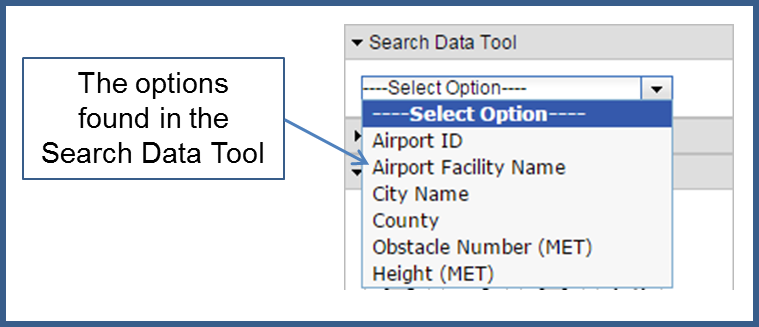
The Search Data Tool allows the user to search by a specific Airport ID, Airport Facility Name, City Name, County, Obstacle Number (MET) and Height (MET). The first five categories are controlled by filtering selects; this means a list will be displayed and continue to update as users type. The last option consists of radio buttons and a number spinner.
(top)
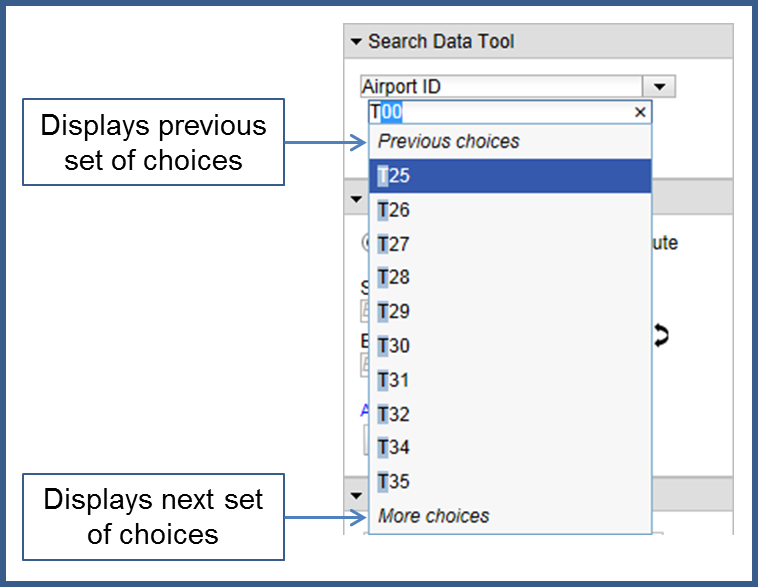
There is a max of ten choices displayed in the list at one time to prevent long running lists. If a list contains more than ten choices a “More choices” item will be found at the bottom of the list; clicking this item will display the next set of choices. When the next set of choices are displayed a “Previous choices” item will appear at the top of the list; clicking this item will display the previous set of choices.
(top)
Once the user has entered/selected the value they are searching for the map will zoom to the extent of the returned data, the interactive legend will update accordingly and the returned data will be displayed on the map and in the data grid.
(top)
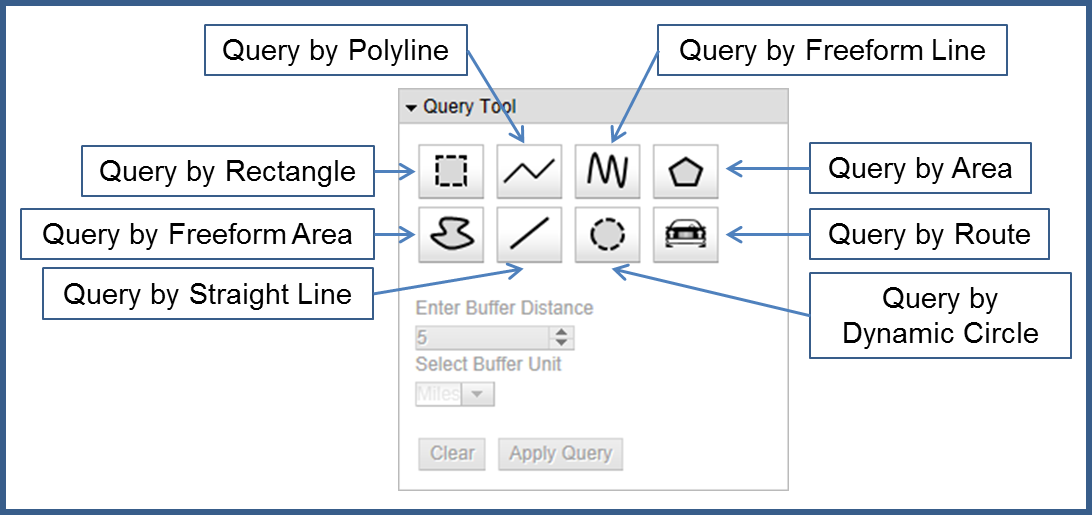
The Query Tool gives the user the ability to select a subset of information from the layers added to the map via the
following options; query by rectangle, query by polyline, query by freeform line, query by area, query by freeform area,
query by straight line, query by dynamic circle and query by route.
Note: if the Search Data Tool is active only the displayed data will be queried.
(top)
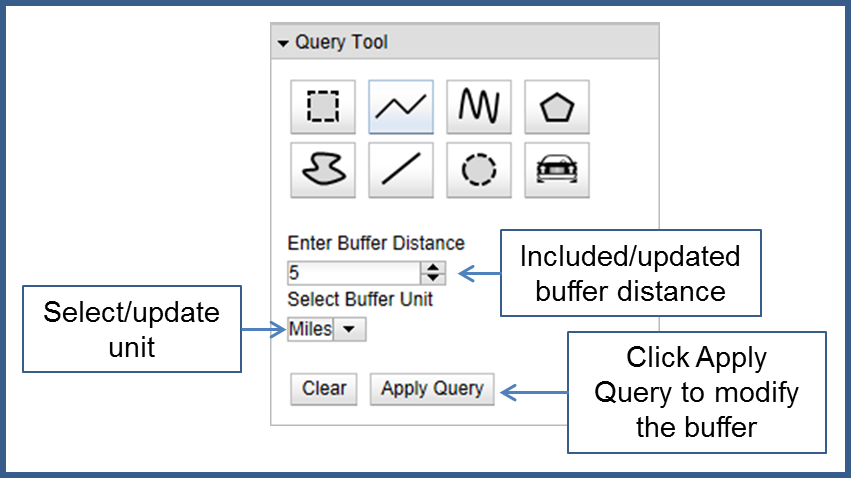
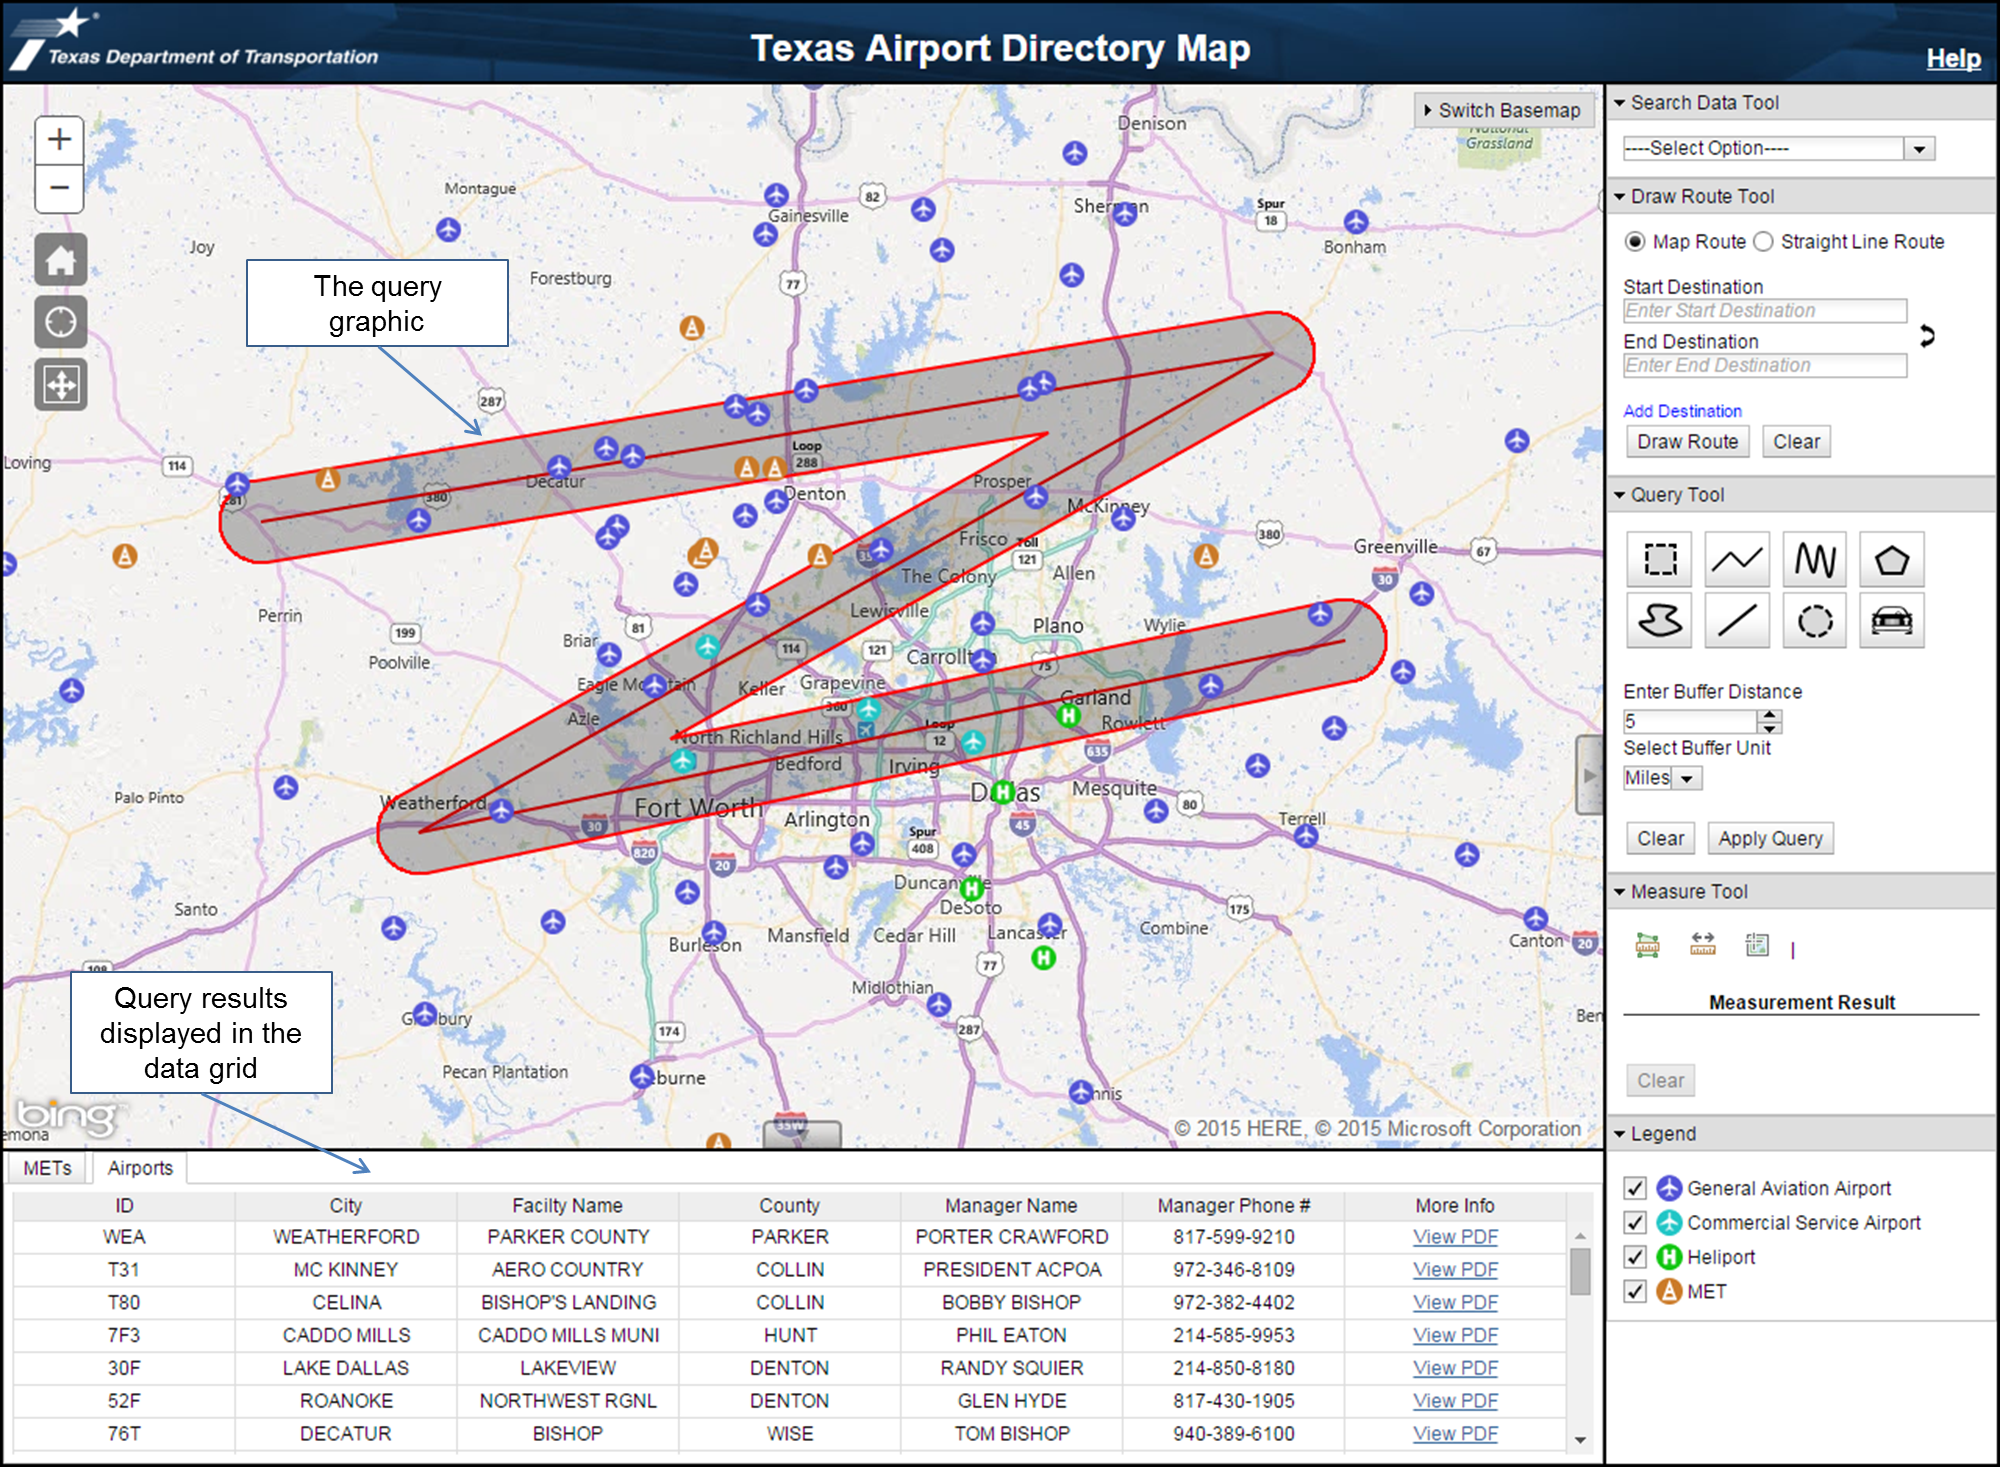
If the user selects a line query they can include a buffer around the query graphic to expand the query area. If a buffer is not included the default buffer of 5 miles is automatically added. The results of the query will be displayed in the data grid and the map will zoom to the extent of the query. The user can update the buffer after they have completed drawing the query graphic by changing the distance and/or the units then clicking the Apply Query button. If the user adds/removes layers with the interactive legend while a query graphic is displayed the query is automatically reran on the displayed data.
(top)
Once the user has completed drawing the query graphic the map will zoom to the extent of the query graphic and the returned data will be displayed in the data grid.
(top)
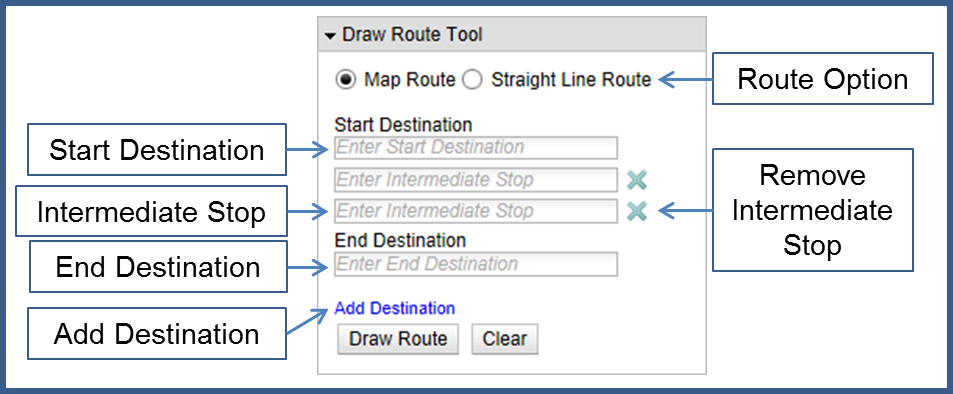
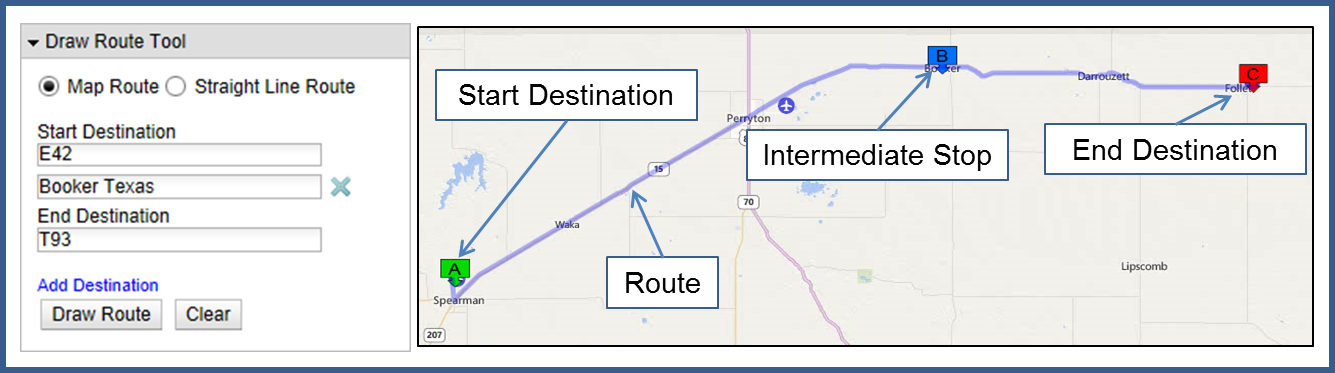
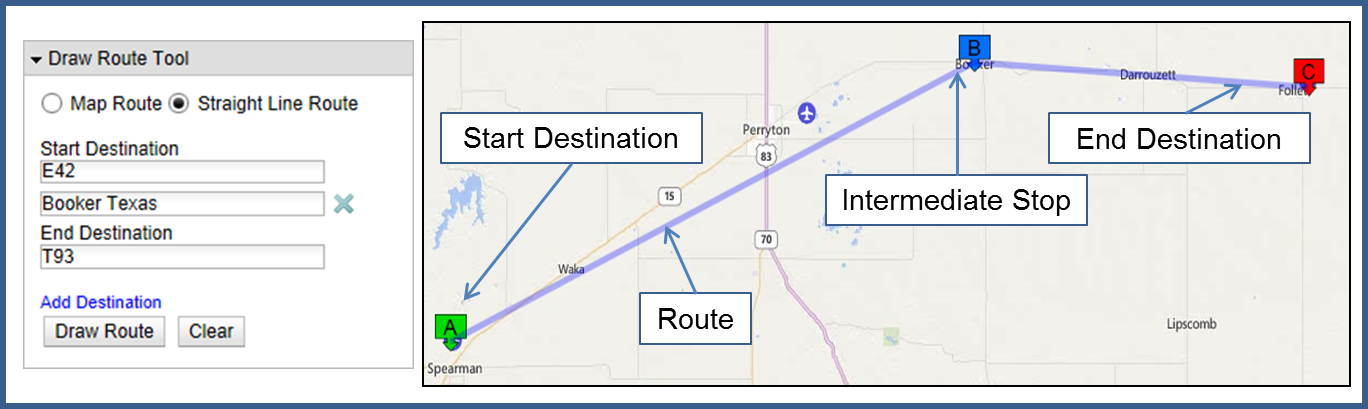
The Draw Route Tool allows the user to define a route by entering a start destination,
an end destination and
up to ten intermediate stops. The user also has the option of drawing a map route, route that follows defined
roads, or a straight line route.
Note: acceptable destinations are any known address (the more specific the better), Airport ID’s, Obstacle Number (MET)
and latitude/longitude coordinates.
(top)
After the user has entered the start/end destination and any intermediate stops, the user must click the Draw Route button. Upon doing so either a map route or straight line route connecting the supplied destinations will be displayed on the map and the map will zoom to the extent of the route.
(top)
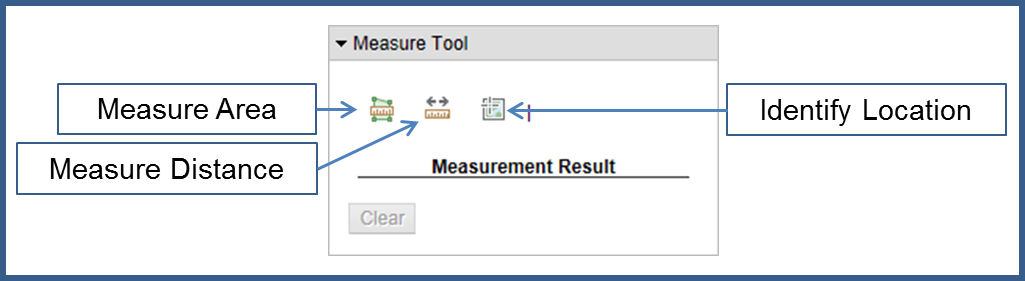
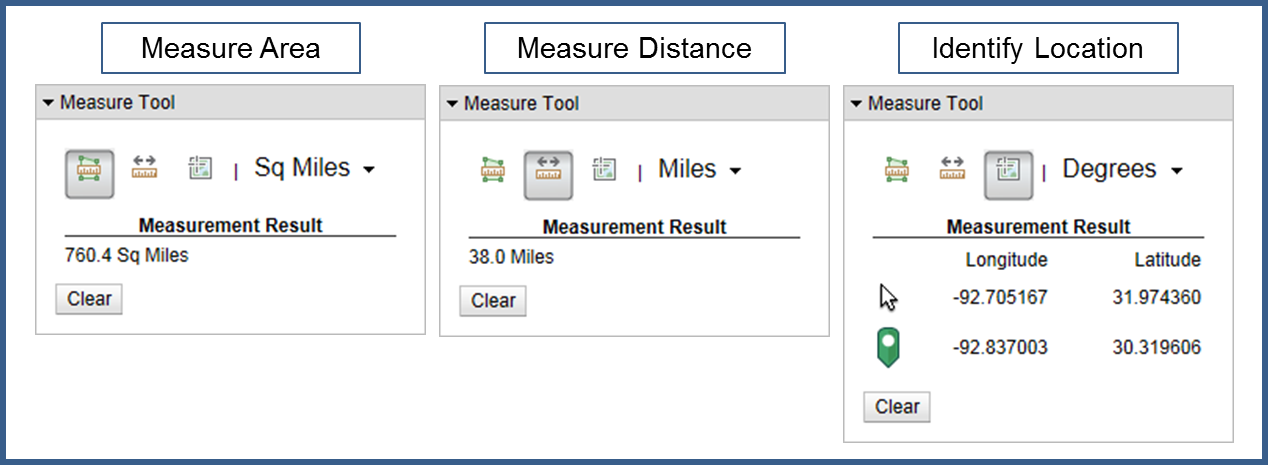
The Measure Tool allows users to draw features on the map to measure areas, distances, and identify locations via latitude/longitude values.
(top)
Once an option is selected a drop down with corresponding units is displayed. After selecting the units simply draw the desired shape on the map to begin measuring. To stop the measuring process double click; the area or distance measured will be displayed in the Measurement Result section of the Measure Tool. To get an effective measurement the Area option requires at least three points and the Distance option requires at least two points. The Identify Location option displays the latitude/longitude of the mouse cursor; clicking will add a graphic to the map and display the location of the graphic in the Measurement Result section.
(top)